In 1996, the Arava Institute joined forces with people around the world to accurately measure rising levels of carbon dioxide in our atmosphere.
By collecting air samples every week over the past 25 years, the Institute has made more than a thousand observations showing how the composition of our atmosphere has changed through time.
As part of my internship, I joined József Kádár, Research Assistant at the Center for Renewable Energy and Energy Conservation, to see exactly how air samples are collected here.
Loading his club car with a specialized suitcase containing a pump and two glass flasks, József drove us to the farthest corner of the Ketura solar field to collect the samples. A light breeze was blowing from the mountains to the west, exposing us to clean and unpolluted air–exactly what we needed to proceed with sampling. József extended a pole a few meters above the ground, opened the valves on the flasks and activated the pump. Hearing it kick into action, we turned our backs and walked away to avoid contaminating the sample with carbon dioxide expelled from our own lungs.

Only approaching once the flasks had been flushed and filled, we closed the valves to capture the sample for good. Then, with everything packed up, we brought our precious cargo back to the lab, taking care not to speed over the bumps in the road.
This is exactly the same way air samples have been collected here for the last 25 years. At one point, the responsibility was even held by Dr. Tareq Abu Hamed, now the Institute’s Executive Director.
Inside the lab, József transferred the flasks back into the box in which they arrived. Battered and worn on the outside, the box was well padded on the inside and had safely carried flasks back and forth across the globe dozens of times already. The flasks were now on their way back to the National Oceanic and Atmospheric Administration (NOAA) in Boulder, Colorado, USA.
Once the flasks get back to NOAA, they will be processed at the Global Monitoring Laboratory. Scientists will analyze the air samples to accurately measure levels of carbon dioxide, methane, and other greenhouse gasses. At the end of this process, one new data point will be generated and added to the record showing precisely how much our atmosphere has changed through time.
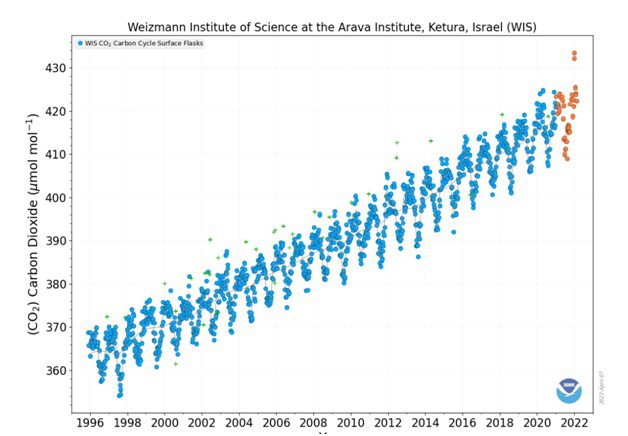
In this complete record of data from Ketura, we see a persistent upwards trend showing that the mean concentration of carbon dioxide increased from around 365 parts per million (ppm) to around 415 ppm between 1996-2022. The zig zag pattern is caused by plants, which uptake carbon dioxide to support growth during the spring and summer.
The data from the Arava Institute is complemented by observations from over one hundred sites around the globe, “from the northern tip of Alaska to the Gobi Desert in Mongolia and even to the snowy wastes of the South Pole in Antarctica.” At NOAA Global Monitoring Laboratory, flasks from all these sites are processed and analyzed to provide a comprehensive view of change across the globe. Equipped with these long-term data sets, the international community can more reliably understand and predict how climate change affects the planet.
Collecting air samples is one way I see the Arava Institute promoting transboundary cooperation to address today’s environmental issues.
Submitted by Jackson Vanfleet-Brown from San Francisco, USA, who is currently an intern at the Center for Transboundary Water Management.